 SBAROUNIS & ASSOCIATES TRANSPORT INFO & CONSULTANCY
Utilising spreadsheet formulae for automating parameter-driven, repetitive drawing tasks through AutoCAD® scripts: A step-by-step introduction by beginners for beginners
Preface
The following techniques have been tested with the dominant commercial packages of Excel®, AutoCAD® and DraftSight® and the public-domain spreadsheet OpenOffice Calc. In addition, the free, outstanding "Notepad++" text editor or a similarly-behaving one (definitely not the Microsoft Notepad utility) is required as a secondary aid in order to modify spreadsheet output into AutoCAD®-compatible commands.The author is aware of more sophisticated procedures using Visual-Basic® -and has in fact experimented with such ones in the distant past in the context of the competing CAD (Computer-Aided Design) package "Imagineer" by Inter-graph®, which provides Visual-Basic® integration-. Anyway, the additional burden and software modules for Visual-Basic programming seem to be worth the effort and work-hours only for far more complex drafting tasks (for example, design of multi-part mechanisms and systems). Simpler applications seem to justify more convenient ASCII scripts like the ones presented here. In addition, the techniques described here are more globally applicable, even to primitive software versions preceding not only Visual-Basic®, but even MS-Windows® themselves! To an extent, they can be considered as independent from the operating system.
The opportunity for compiling the present essay arose from the requirement to automate painstaking repetitive modifications/variations of numerous elements of subway emergency evacuation drawings (particularly escape route scenarios). The exploration of the capabilities and limitations of ASCII scripts led to the major MACRO-DEMOS described herein. Given the scarcity of relevant free on-line tutorial stuff, we considered it a good idea to publish parts of the work performed. Mind you that the techniques described here are only recommended for custom-made, do-it-yourself drawing aids. Distributing macros to others beside their original creator as ready-to-use tools is not advisable, since each macro's logic, especially for the more complicated -and consequently potentially useful- ones, is difficult for outsiders to grasp effectively and adopt efficiently to their individual purposes.| The most important prerequisite for comprehension and effective utilisation of the described method is familiarity with vector/analytic geometry, which enables users to produce the appropriate coordinates through spreadsheet formulae and thus create the desired drawing entities. As far as AutoCAD® knowledge is concerned, the greater familiarity with the command line language and behaviour, the more capability and versatility is available to the user to tackle his/her repetitive drawing chores, it really sets the limits of what can be achieved. In contrast, no use is made of the AutoCAD® Graphic User Interface (GUI), and thus no familiarity with this is necessary at all. |
General concept and some tips before starting.
The spreadsheet files contain the appropriate AutoCAD® commands and the numeric formulae that yield the desired coordinate/dimension correlations of the various drawing entities. However, spreadsheet formats contain tabs and other undesirable ASCII elements, which confuse AutoCAD® programs and prevent commands from being executed. So, the desired spreadsheet portions are dragged-and-dropped into Notepad++, where all tabs can be automatically eliminated and other modifications can be manually performed as well at will. Finally, the modified Notepad++ content is copied and pasted into the AutoCAD® command line, et voila! The objects are there!Great attention and patience is required for the correct placement and number of spaces, commas etc. special ASCII characters within the code. Take a careful look at the demos to grasp the general idea! Undoubtedly, many trial-and-error attempts will be required until any macro portion runs smoothly as intended. In ready-made demos, the placement and number of spaces is especially hard for the reader to detect (the search function of "Notepad++" will help), practice however will render these problems insignificant. On the other hand, the alternative of employing the aforementioned sophisticated Visual-Basic techniques would require at least as much patience and trial-and-error attempts.
After every macro-script execution, it is imperative to scroll back through the AutoCAD®-generated command line messages for checking if AutoCAD® has displayed any error feedback, which will indicate either syntax errors in the script itself, or geometric incompatibilities in the attempted drawing. For instance, you will realize frequently in one of our demos that a line drawn from a specific point as tangent to a randomly-generated arc, will -quite logically and expectedly- produce an error warning if the given start-point lies inside that arc.Demo-project #1: Getting familiar with the script syntax
Block #1
The AutoCAD®-command line language is throughout usable. So, we begin typing the desired shapes to be drawn in our worksheet. Let's start exploring the leftmost portion of the worksheet, which will look somewhat like this:
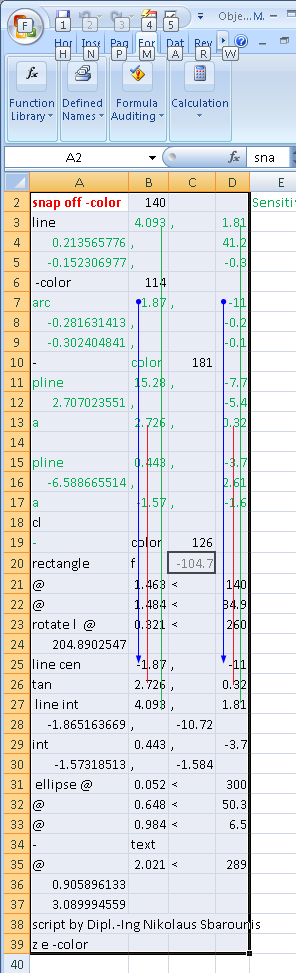 We already recognize some familiar keywords from our CAD experiences, like "LINE", "ARC", "ELLIPSE" etc. Their execution in the command line soon afterwards will produce the desired shapes at the desired locations. Further, we notice special ASCII characters, first and foremost the spaces. Sometimes 2 or more consecutive spaces will be required in order to invoke the equivalent "enter" keystrokes during the command line execution. It is visually difficult to determine these locations, but hands-on experimenting with the commands will help to overcome this. Another special ASCII symbol is the comma separating Cartesian X-Y coordinates. Apropos coordinates, experienced CAD users will observe that, for demonstration purposes we have included a mixture of Cartesian and polar ones, the latter being signified with the "@" and "<" ASCII signs (the "@" signifying the distance from a reference point and the "<" signifying the angle to the horizontal X-axis).
| Now, on to some notable features of the individual syntaxes demonstrated herein: | ||
| snap off -color 125 | "SNAP OFF" is not technically imperative, but it does eliminate the annoying "snap" of the cursor which AutoCAD® activates by default when opening specific blank drawing templates.
Keep in mind that blanc cells play no role, no matter how many, since the resulting tabs are to be entirely eliminated every time the stuff is drag-and-dropped into the text editor during the process. No need to worry about them, since they may offer significant visual assistance while editing our worksheet. However note that:
| |
| rectangle f xxxx | A RECTANGLE is drawn with a randomly selected filet "F" radius which may be positive, negative or of no effect to the shaping of the rectangle | |
| rotate l | The hitherto last (keyword "L") entity drawn (in this case the rectangle) is selected in order to be rotated. The "@ aaa < bbb" syntax indicates a rotation centre selected through relative polar coordinates and the rotation angle is specified immediately underneath. | |
| line cen x1,y1 tan x2,y2 int x3,y3 x4,y4
...etc | Further down, we continue to draw more shapes, not scattered randomly any-more but in spacial correlation with others. At the screen-shot above, we have drawn the attention to some of these correlations using coloured connecting lines. For instance, the "LINE CEN" command starts a line from the centre of the previously drawn arc that passes from the referenced coordinates. This line is then commanded to be a tangent (codeword "TAN") to another existing arc, passing from the next set of coordinates. As repeated previously, in case our randomly drawn arc engulfs the centre of the other one, such a tangent is impossible and will be omitted from the drawing.
Note: The intersection (keyword "INT") option uniquely requires 2 sets of coordinates, since it needs to pick 2 intersecting entities, not just a single one. Again, this part of our demo may fail to produce a result if the 2 randomly drawn objects don't happen to intersect. | |
| - text | At some point, specifically after drawing an ELLIPSE, we demonstrate writing some TEXT. As in the "COLOR" command previously, we precede it with a minus sign "-" in order to avoid the interrupting dialogue box for text input and import the text content directly from the generated command line. Once again, we define the start-point through relative polar coordinates (row 35), then we Specify size (row 36) and rotation angle (row 37) of our text, and finally the text itself (row 38), which reads "by N. Sbarounis for Athens Transport" (how predictable!). | |
| z e | This is the easiest one. In order to see immediately what we have done, we automatically (z)oom the (e)xtents of the drawing. | At this point, we recommend to interrupt reading and start playing a little with the actual stuff. First of all, we suggest downloading now one of the ready processed text files, opening it in Notepad++, copying its content to the clipboard and paste it to the command line of AutoCAD®. YOU SHOULD GET THE OBJECTS IMMEDIATELY DRAWN AND ZOOMED AT!
You can tamper with the numeric content in Notepad++ , paste the modified content through the clipboard to the AutoCAD® command line and observe the result (every time preferably in a new, vacant AutoCAD® window, so that the stuff does not overlap with the one previously created, unless you really want to see it overlapping). However keep in mind that if you change certain coordinates, the objects intended to be created in dependence to others drawn independently will mostly fail to materialize since the referenced coordinates will not match any-more.
Second thing you will want to do, download the spreadsheet itself. You will notice it contains several worksheets, please select the one named "Cartesian". We now move to:
Transferring correctly the appropriate spreadsheet content to the text editorSelect a worksheet area similar to the one visible at the screen-shot above beginning with "snap off" (i.e. cells A2 to D39). Drag and drop this into a vacant new tab in Notepad++. In order to remove all tabs, the most convenient way is to select a tab-stop within the Notepad++ file under process (no matter which tab) and press Ctrl-H (the shortcut for replacement). Normally, the dialogue window will already prompt you to replace tab-stops (indicated with a large, highlighted space). Leave the substitute text box empty (in order to replace tab-stops with nothing) and press "replace all". You will get a much more compact view of the content after this removal. Press Ctrl-A to select all contents and copy it to the clipboard. Afterwards, you left-click the command line prompt of your AutoCAD® program and then right-click it. You will see a context-sensitive menu, from which you will left-click the "Paste" option. Again, you should get the objects immediately drawn and zoomed at! However, these are not the only objects intended to be drawn, as you will see in the immediately followingBlock #2We purposely omitted to mention that this worksheet named "Cartesian" contains more stuff than the code explained so far. Let's look at it more carefully: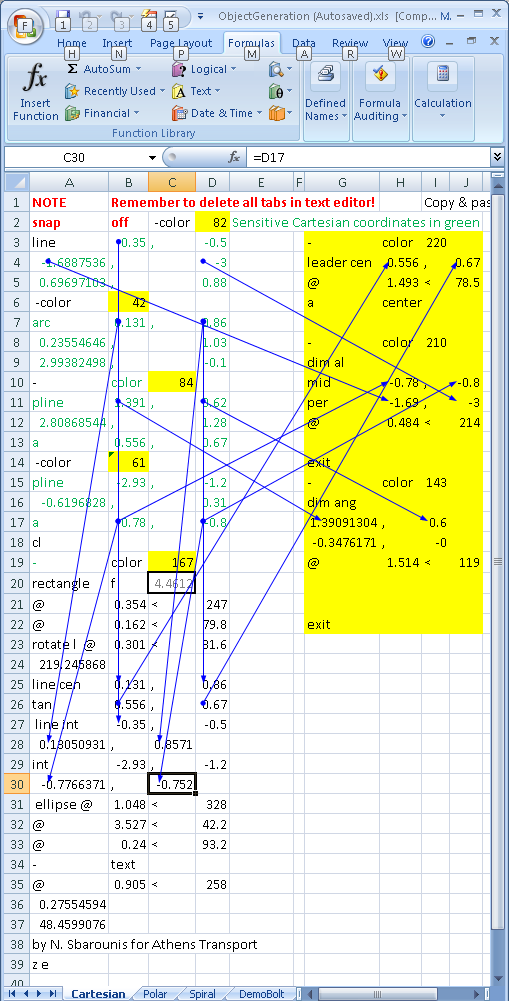 See a second block of cells painted yellow (we call it "Block #2") on the right of the first? We decided to help ourselves by splitting the desired drawing operations between easily manageable blocks, determined by the worksheet portion visible in an ordinary 1280x1024 resolution (typically about 40 rows maximum). So, in order to complete our intended task, we can open a further vacant new tab in Notepad++ , drag and drop the whole yellow area in it (cells G3 to J22). Again, we remove all tabs by repeating the steps described in the large, underlined text above. Pasting this additional content in the AutoCAD® command line will create the respective additional content. Let's have a detailed look at it: A first striking feature is that many interdependencies have again been marked with arrows. And very rightly so, because our yellow "Block #2" is intended to demonstrate ways we annotate some already drawn objects. More specifically: See a second block of cells painted yellow (we call it "Block #2") on the right of the first? We decided to help ourselves by splitting the desired drawing operations between easily manageable blocks, determined by the worksheet portion visible in an ordinary 1280x1024 resolution (typically about 40 rows maximum). So, in order to complete our intended task, we can open a further vacant new tab in Notepad++ , drag and drop the whole yellow area in it (cells G3 to J22). Again, we remove all tabs by repeating the steps described in the large, underlined text above. Pasting this additional content in the AutoCAD® command line will create the respective additional content. Let's have a detailed look at it: A first striking feature is that many interdependencies have again been marked with arrows. And very rightly so, because our yellow "Block #2" is intended to demonstrate ways we annotate some already drawn objects. More specifically:
|
| leader cen x1,y1 | Will invoke the "LEADER" command (a pointing arrow), wanting to point to the centre (cen) of something circular existing at the coordinates x1,y1. | |
| @a < b | the LEADER will extend for a distance a at an angle b | |
| a center | the annotation (keyword "a") shall read "center" | |
| dim al mid x1,y1 per x2,y2 | An aligned dimension (keywords "DIM AL") shall indicate the shortest distance from the midpoint (keyword "MID") of the entity at coordinates x1,y1 to the entity at coordinates x2,y2. For this reason, we force the aligned dimension to be perpendicular (keyword "PER") to the latter entity. | |
| dim ang x1,y1 x2,y2 | Similarly, a sample of (ANG)ular (DIM)ensioning is demonstrated, printing the angle between the previously drawn line passing from x1,y1 and another one passing from x2,y2. | |
| @a < b | the relative polar placement of the angle indication |
Ways to combine the Blocks of commands or parts of them
Previously, we executed the second, yellow block after the first one. However, we can drag-and-drop Block#1 into a blank text-file in Notepad++, and immediately afterwards the yellow Block#2, underneath the first. We remove all tabs, and then copy and paste all content into the AutoCAD® command line in a blank drawing. Now, the whole lot that we had drawn in 2 steps above, will appear in one go! You can see below a set of objects drawn with this script:
| No Tangent found for specified point. Invalid point. | No Intersection found for specified point. | ...etc.etc... |
|---|
Demo-project #2
We saw how to draw some generic geometry and annotate it. However, the drawing(s) we created look quite abstract and may create the illusion that our methodology is suitable for abstract things only! In order to dismiss this illusion and simultaneously extend our concept to the 3-dimensional world, we suggest a second Demo-project to design a very real and useful piece of engineering, namely bolts!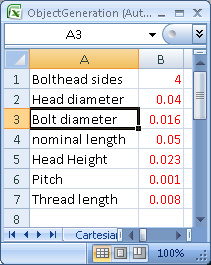 First of all, we need to write down on a spreadsheet form all the parameters that will have to be entered in order to define our bolt. This time, in order to keep our project tidy, we shall use a separate worksheet (named DemoBolt) for parameter input and a separate one with the final commands (named MacroBolt extrude) destined for dragging into Notepad++ and hence into the AutoCAD® command line. Our input sheet is depicted on the left.
 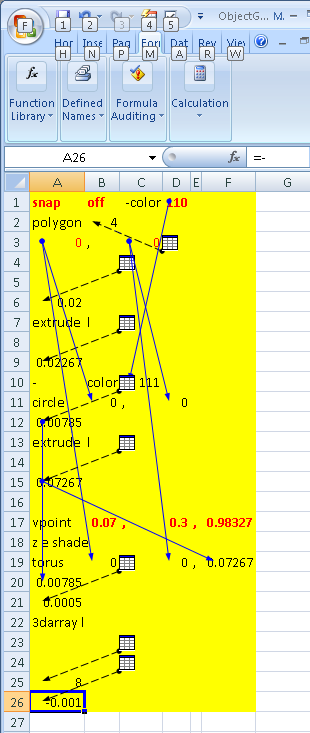 The data entered there influences through appropriate formulae almost all the design parameters in the other worksheet (the yellow one on the right) intended for execution (you know how to connect via formulae cells of separate worksheets within the same workbook, don't you?). You notice the dashed connection arrows starting from these rectangular icons, which indicate either a direct transfer of this number from another sheet, or an algebraic formula referring to a parameter stored in another sheet (in this case the data entry form on the left). Continuous arrows refer to interrelations between the respective local cells, same as depicted in the previous demo.
Having cleared this out, let's see the actual commands used for our geometric model: a POLYGON will represent the bolt head, featuring the number of sides entered on the data input sheet (the red numbers under the "polygon" command are the coordinates of its centre). We EXTRUDE it upwards by the appropriate height to make it 3-dimensional. Next, a CIRCLE with the same centre will be drawn and immediately extruded by the entered nominal length to represent the shaft of the bolt. Finally, for a rough visual approximation of the thread, we draw a TORUS at the end of the bolt, then we multi-replicate it downwards as a 3DARRAY, as many times as the pitch fits into the thread length. This number is the last one in our sheet and you notice it is negative because we start the array from the top of the bolt downwards. All these mathematical and geometrical correlations can be examined in the accompanying spreadsheet. We'll (Z)oom the (E)xtents of the drawing in order to optimise our view and SHADE it in order to obtain a realistic rendering of our creation. The result must look somewhat like this: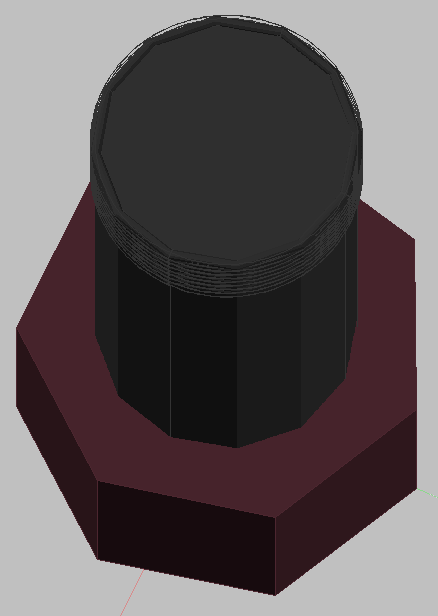
The numbers painted red in the command sheet can be changed at will, as well as the primary bolt data in the input sheet. We differentiate a little bit the -COLOR between the bolt head and the shaft, otherwise it is kind of difficult to tell them apart under the AutoCAD® shading.
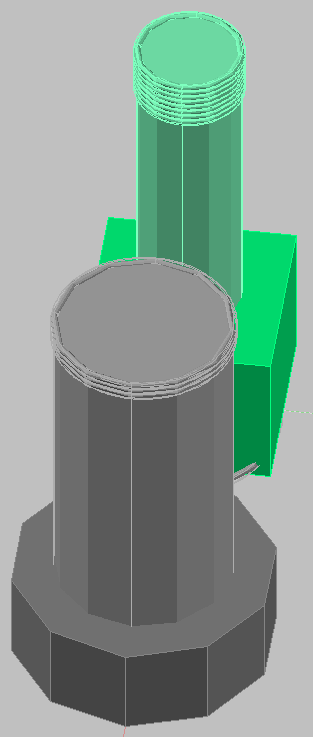
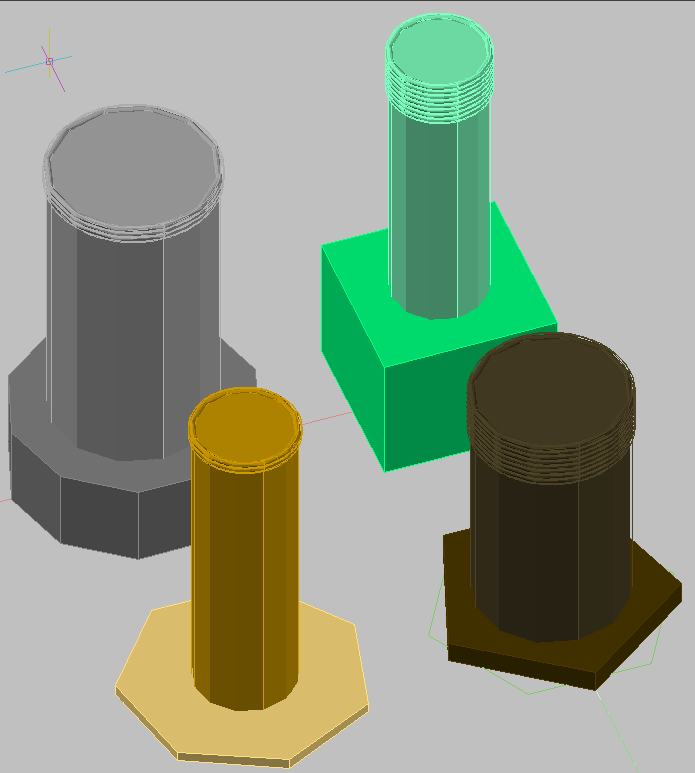
Now, let's do a final trick: We change the POLYGON centre coordinates a little bit (about twice the bolt diameter) in the yellow worksheet, alter the bolt data in the data entry form at will, and transfer the content into the AutoCAD® command line in the workspace where we drew our bolt. We'll see a second bolt appearing beside the first, like this:
Some closing, generic tips
- Theoretically, strings of commands can be developed along oversized horizontal rows with equivalent results on the end product. This would diminish the need for parallel, vertical blocks of commands that have to be assembled in sequence. In practice, this would become quite inconvenient and unmanageable, since the human eye will deal more easily with short lines, arranged vertically. Not to mention the mess that will result when we attempt to rearrange/interchange script portions.
- Apart from the spreadsheet itself, whenever you are satisfied with your results or you judge them to be significant for any reason, make sure to save the resulting drawing and, most importantly, the text file. They will prove to be valuable for reference.
- Do yourself a favour and use 2 monitors under an extended desktop setting (as every serious CAD user would anyway), in order to have a clear view of your drawing on one and all the text stuff (spreadsheet, Notepad++ and a detached AutoCAD® command line) on the other.
- Last but not least, every time you are about to add a new command to a worksheet macro, test it manually in AutoCAD® beforehand. You will see what this command prompts for, and include it properly in your intended keystroke sequence (either as numbers / coordinates, or as blank lines, or as mere spaces). Thus, you achieve a minimal annoyance of trial-and-error attempts.
